-
What is tuneable diode laser spectroscopy for combustion applications?
Date posted:
-
-
Post Author
dev@edge.studio
1. General
[GLOSS]Laser[/GLOSS] spectroscopy is a powerful tool to conduct [GLOSS]in-situ[/GLOSS] measurements in difficult environments such as flames. Most importantly, concentrations of molecules and atoms can be determined. A typical experimental setup for in-situ investigations of flames is depicted in Figure 1.
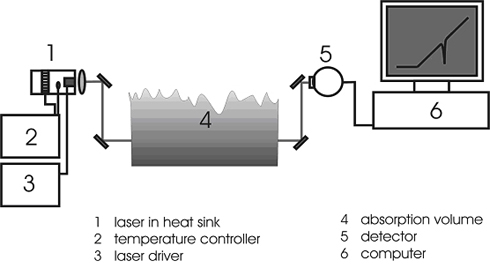
Fig. 1: Experimental setup for tuneable diode laser absorption spectroscopy.
The laser is housed in a thermostated heat sink and is driven by the injection current. The beam passes through an absorption volume (e.g. a flame) before the intensity of the transmitted beam is determined at a [GLOSS]photodetector[/GLOSS] and digitised. As the injection current is ramped linearly, the laser wavelength, in a first approximation, also shifts linearly. It is possible to [GLOSS]modulate[/GLOSS] the laser at high speed to obtain a good temporal resolution in the measurements.
Using tuneable diode lasers, it is possible to determine multiple species concentrations, the temperature and the pressure. By performing time-averaged measurements, the detection limit (usually defined as a blank value plus 3 times the standard deviation) for species concentrations can be lowered and the data becomes more accurate (noise is reduced by a factor of the square root of N, with N being the number of spectra averaged).
2. Infrared spectroscopy
In the [GLOSS]infrared[/GLOSS], many atoms and small molecules can be excited. [GLOSS]Rovibrational[/GLOSS] transitions are induced and the incident light is attenuated. The attenuation of the light is directly proportional to the concentration of the absorbing species.
With I being the intensity of the transmitted light and I0 being the incident light intensity, one can calculate the absorbance A according to Lambert Beer’s law (see CF22).
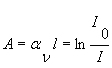
aν spectral absorption coefficient [cm-1]
l path length [cm]
I0 initial light intensity
I transmitted light intensity
The transmittance T is defined as the ratio of transmitted light intensity to incident light intensity.

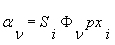
Φ line shape function [cm]
p pressure [atm]
xi mole fraction of the species i
pxi partial pressure of the species i [atm].
The absorbance is directly proportional to pxi.
The line shape function Φ depends on the pressure.
The line strength S is a function of the temperature.
The calculation of absorption spectra is outlined in CF187.
When using lasers as a light source, the spectroscopist faces several advantages compared to conventional light sources. Some of them open up the possibility of performing experiments that can only be performed with coherent light sources. Most importantly, a laser is a bright and spectrally narrow light source.
Using a laser light source, one can obtain well-resolved spectra when conventional methods (like the [GLOSS]FTIR technique[/GLOSS]) are no longer valid due to spectra convolution.
3. Tuneable diode laser spectroscopy
Diode lasers are inexpensive and robust lasers. Their emission wavelength can be tuned by changing the temperature of the laser or by varying the current sent through the laser.
This behaviour allows selecting a single rovibrational line of the molecule under investigation that is free from interference from other species.
The laser wavelength can then be tuned over this absorption line. It is essential that the line width of the laser light is smaller than the width of the probed absorption feature. This is the case with [GLOSS]single mode laser diode[/GLOSS]s. Single mode emission is therefore a stringent requirement for lasers to allow their use in spectroscopy.
Tuning the laser over an absorption peak is more advantageous than only measuring the absorbance at the highest peak position (fixed-wavelength method).
Since one records the absorbance at the peak position and right next to it (i. e. in the valley to its left and right), one can distinguish between specific absorption arising from the presence of the investigated molecule and non-resonant beam attenuation. Non-resonant beam attenuation can be brought about by partial blocking of the beam, reflections and refractive effects.
The following Figure 2 shows the transmittance of a probing laser beam through a flame.
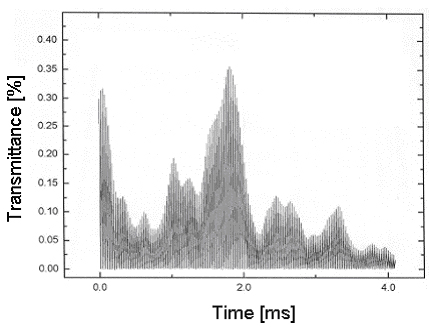
Fig 2: Beam steering causes strong fluctuations of the transmittance of the laser beam through the flame.
One can see that the transmittance changes rapidly over time.
Using a fixed-wavelength method, it is impossible to determine the concentration of any absorbing species.
If the laser is tuned over an interesting absorption feature faster than the time scale of the encountered experimental noise, the concentration of the absorber can be evaluated correctly (refer to Figure 3).
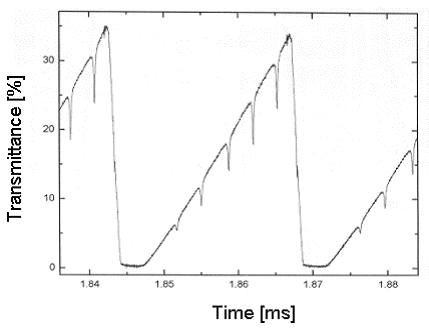
Fig 3: Scheme of a fast measurement.
The transmittance in Figure 2 changes from 40 to 5 % within several milliseconds. A transmission on the order of 1% is enough to correctly determine the concentration of the absorber under investigation.
In the following Figure 4, the principle of data evaluation is shown;
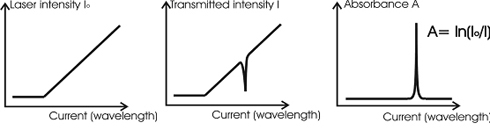
Fig.4: How to determine the absorbance.
One can see three charts. The chart on the left shows the laser output intensity as a function of the injection current. The injection current is linearly increased. The sharp bend signifies the [GLOSS]laser threshold[/GLOSS].
The laser intensity slopes upward because with increasing current, the laser output also increases. The chart next to it shows an absorption peak.
If the two curves are divided by each other and the logarithm is taken, the absorbance is obtained (the chart on the right).
To link the absorbance to a concentration, one can either consult a calculated spectrum or perform some kind of calibration.
There are spectral databases such as [GLOSS]HITRAN[/GLOSS] that contain line positions of many molecules in the infrared (see Fig. 5).
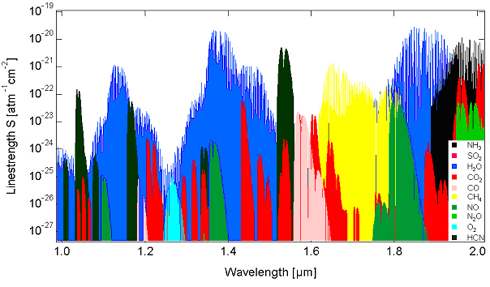
Fig. 5: Some molecules and their line positions in the near infrared region.
One can use these databases to calculate absorption spectra in order to select suitable transitions. Special attention must be paid to interference by other species. Water vapour exhibits many transitions in the infrared. Therefore, one has to select an appropriate “window”. For temperatures above approx. 1300°C, the usual spectroscopic databases are not applicable. [GLOSS]HITEMP[/GLOSS] is a database dedicated to high temperature regimes and can be used to calculate absorption spectra at very high temperatures.
4. Limits of the technique
As shown in Fig. 5, it is possible to access a wide variety of small molecules (e.g. O2, H20, CH4, CO, CO2, NH3, HCN, NO, N2O). Molecules with more than three elements can usually not be determined accurately due to strong spectral broadening. It is possible to detect radicals (e.g. OH) and atoms (e.g. K, Na) as well. The following Table 1 lists some detection limits:
|
Molecule |
Formula |
Wavelength |
Detection limit |
| Water | H2O | 1.390 µm | 60 ppb |
| Carbon Dioxide | CO2 | 1.960 µm | 3 ppm |
| Carbon monoxide | CO | 1.570 µm | 30 ppm |
| Nitric oxide | NO | 1.800 µm | 60 ppm |
| Methane | CH4 | 1.650 µm | 600 ppb |
| Hydrogen chloride | HCl | 1.790 µm | 150 ppb |
| Hydrogen cyanide | HCN | 1.540 µm | 300 ppb |
| Ammonia | NH3 | 1.500 µm | 800 ppb |
| Oxygen | O2 | 0.760 µm | 80 ppm |
Table 1: Detection limits for some molecules (Assumptions: absorbance 10-5, 1 m path length, 296 K).
Absorption spectroscopy is a straight forward technique. Depending on the path length and the transition selected, small concentrations can readily be measured. As a line of sight technique, one obtains path averaged results. That might be beneficial to elucidate the performance of a combustion process.
5. Practical Applications
Absorption spectroscopy allows quantification and is also very inexpensive and relatively simple to perform. Therefore, it is often the method of choice.
A wide range of pressures (sub-atmospheric to elevated), molecules (mostly small ones) and temperatures (several 1000 K) can be accessed.
Diode lasers are already in use in combustion process control applications made possible by the short time response (< seconds). Examples of industrial applications include incinerators, the petro-chemical industries and thermal power plants.
A key advantage of TDL systems is to perform measurements “right at the spot” in the process, rather than at the chimney. This prevents potential falsifications and sources of error introduced by a traditional sampling system.
High sensitivity with the capability to measure accurately trace gas concentrations of less than a ppb, high selectivity for a particular gas species, a high dynamic range with a linear response over more than four magnitudes of concentration, low maintenance and operating costs, and a fast response (measurement speeds of fractions of a second) are additional advantages.
6. Related Special Techniques
There exist several modifications of plain absorption spectroscopy; in cavity ringdown-spectroscopy ([GLOSS]CRD[/GLOSS]), extremely low detection limits are achieved by exploiting long path lengths of a laser beam bouncing back and forth in a cavity formed of two highly reflective mirrors containing the absorber.
In wavelength modulation spectroscopy ([GLOSS]WMS[/GLOSS]) and frequency modulation spectroscopy ([GLOSS]FMS[/GLOSS]), the fact that detection noise is greatly reduced at higher frequencies is used.
Compared to the aforementioned techniques, [GLOSS]NICE-OHMS[/GLOSS] allows the detection of the lowest values of absorbance and hence shows the lowest detection limit.
Sources
[1] W. Demtröder, Laser Spectroscopy, 2 nd Ed . Springer-Verlag, Berlin, 1996
[2] M.-C. Amann, J. Buus, Tuneable Laser Diodes, Artech House, 1998
[3] G. Totschnig, PhD Thesis, Vienna University of Technology, Vienna, 2002
[4] Rothman, L. S., Rinsland, C. P., Goldman, A. et al. The HITRAN molecular spectroscopic database and Hawks (HITRAN atmospheric workstation): 1996 edition, J. Quant. Spectrosc. Radiat. Transfer, 1998; 60 (5):665-710