-
‘Flaming June’…
Date posted:
-
-
-
Post Author
Philip SharmanIFRF Director
-
-
![]()
What does the expression ‘Flaming June’ mean to you? Perhaps it evokes the stunningly rich colours of Sir Frederic Leighton’s classicist magnum opus of 1895 (a favourite of card and notelet producers, although these fail miserably to capture the glory of the 1.2-metre-square original in Puerto Rico’s Museo de Arte de Ponce)… or perhaps, as in my case, it brings to mind stiflingly hot days sweating over some examination or other!
Well, what is clear, is that the month of June – the world over – is ‘flaming’ all the more, with June 2019 the hottest June ever recorded. So say researchers at the EU’s Copernicus Climate Change Service (‘C3S’), implemented by the European Centre for Medium-Range Weather Forecasts (ECMWF) on behalf of the European Commission. According to C3S’s website, “June 2019 was the world’s warmest June on record (1.2°C above the pre-industrial era and about 0.1°C higher than that of the previous warmest June, in 2016 ). Most land and ocean areas saw higher than average temperatures, with the few exceptions including much of western Russia and Canada”.
Homing-in on Europe, the European-average temperatures were more than 2°C above the pre-industrial level, which was almost 1°C above the previous warmest June for Europe, in 1999… gulp!
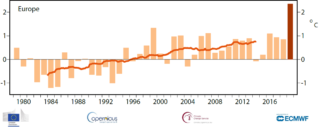
Figure: European-average temperature anomalies (°C) in June from 1979 to 2019 (in dark red) relative to the 1981-2010 June average. Red overlay line: 10-year running averages for all months [Credit: ECMWF, Copernicus Climate Change Service]
So, what about this image… what does this convey to you?
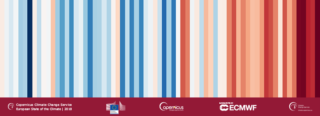
Well, in this case the orange and red hues (that Leighton would no-doubt have approved of) are definitely not there to instil a sense of restful slumber! C3S has used these ‘Warming Stripes’ in an attempt to visualise and communicate the upward trend in global temperature, with the particular set of stripes above representing the temperature changes in Europe from 1950 to 2018 (Credit: C3S/KNMI). Since their first use as a communication tool in 2018, these powerful Warming Stripes have been widely adopted to help illustrate local and regional warming trends (see climate-lab-book.ac.uk for further examples). Perhaps the message here is more akin to the toxic oleander branch in Leighton’s painting, the inclusion of which is thought by some to symbolise the link between sleep and death… (deep for an engineer, eh?!).
… and now July too (to be confirmed)!
And now July 2019 looks set to be ‘declared’ the warmest month ever recorded, worldwide. Stated more precisely, according to C3S a preliminary analysis of global temperature data for July suggests it may have “marginally” become the warmest month on record. Data from the first 29 days of a month in which many countries experienced heatwaves are “on a par” or slightly higher than a record set in July 2016. Confirmation of this new (and ominous) record must await a full analysis being released today – just as we issue this edition of MNM.
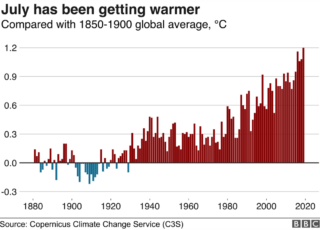
Figure: July global temperature (°C) compared with the pre-industrial era (1850-1900) [Credit: BBC, C3S]
How much warmer is your city?

Talking of interesting and engaging tools that communicate the challenge of climate change effectively, the BBC’s Visual and Data Journalism Team has just launched an excellent animation and associated app titled ‘How much warmer is your city?’
You can spin and tilt an animated globe to see the how much July temperatures have increased between 1880-1900 and today, i.e. <0°C (colder), 0°C (same), and 0-1, 1-2 and >2°C (hotter), in different parts of the world. For recent years, a 10-year average 2009-2018 is used, to more accurately reflect recent warming. The temperature change data is stored in squares measuring 100x100km.
You can then find out how much the area around your nearest city has already changed – and what may lie ahead. Data for 1,000 large cities are built into the app, showing January and July temperatures over the years from the pre-industrialised era to the present, and for the rest of this century under four scenarios – ‘best-case’, ‘medium-low’, ‘medium-high’ and ‘worst-case’ scenarios. For my nearest city (Oxford in the UK), the model indicates that average January temperatures could rise by 2.3, 3.3, 3.4 and 4.9°C by 2100 (compared with 1900) under the four scenarios, whereas average July temperatures could rise by 2.1, 3.2, 3.9 and 5.6°C…
As well as explaining the basis for the data and the various climate change models used, the webpage also provides some interesting facts, impacts and explanations for different parts of the world.
Worth a look when you have a spare half-hour and a stiff drink to hand!