-
How do I use photocells to measure flame radiation?
Date posted:
-
-
Post Author
dev@edge.studio
1. Background
A [GLOSS]photoconductive cell[/GLOSS] is a light-sensitive sensor which was originally developed in the late 19th century. These cells have found a number of applications in the field of combustion, including the detection/measurement of flame radiation.
A number of commonly used photoconductive materials, such as lead sulfide (PbS), lead selenide (PbSe), and lead telluride (PbTe) are sensitive to infrared radiation, whereas cadmium sulfide (CdS) responds to light in the visible range. Photoconductive cells nowadays are widely available off-the-shelf and in practice, the required [GLOSS]spectral response[/GLOSS] of the cell can be custom-matched using additional spectral filters. This is important when measuring narrow-band spectral radiation such as those from [GLOSS]chemiluminescent[/GLOSS] processes.
This combustion file describes the principle of operation of photoconductive cells as well as the auxiliary circuitry which is employed to measure flame radiation.

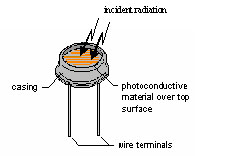
Figure 1: Schematic representation of a photoconductive cell
2. The Importance of Measuring Flame Radiation
Measurement of the radiation characteristics of flames can yield important information on the flame temperature and combustion behaviour as illustrated by the following applications. For many years, [GLOSS]flame flicker[/GLOSS] has been a means for reliably detecting the presence of flames in large utility boilers burning pulverised coal [1]. In a study by Hurle et al . (1968), it has been shown that changes in the intensity of chemiluminescent radiation from C2 or CH radicals in the flame front can be used to indicate the overall rate of combustion [2]. Also the intensity of chemiluminescent radiation from CH and CO2 has also been shown to be a good indicator of the local equivalence-ratio in the flame and so potentially can be used for optimising the air-fuel ratio of a burner [3]. For luminous flames, the mean flame temperature can be determined by measuring the flame radiation brightness at two closely spaced wavelengths in the visible spectral region using the brightness of a tungsten lamp as the calibration source [4].
3. Principle of Operation
The electrical resistance of the photoconductive material decreases when the intensity of the incident radiation increases. The change in electrical resistance of the photoconductive cell, see Figure 1, can be conveniently detected by means of a voltage-divider circuit as shown in Figure 2. According to Ohm’s law, the output voltage is given by:
 (1)
(1)
A direct-current (dc) bias voltage (Vsupply) between 5 to 15 volts is commonly used and, as a rule of thumb, the value of the load resistance RL can be selected to be approximately equal to the resistance of the cell when viewing the flame under “normal” burner operation. Since RL is constant, it follows that the output voltage of the circuit increases with increasing intensity of the flame radiation. Therefore, the fluctuations in the flame radiation can be detected as corresponding fluctuations in electrical voltage.

Figure 2: Standard circuit for the voltage-divider
4. Signal Amplification
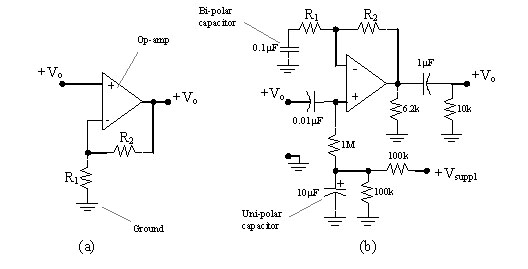
The output voltage may be amplified to suit the input-limits of the intended data acquisition hardware. Essentially, there are two types of signal amplifier, namely, [GLOSS]dc-coupled[/GLOSS] and [GLOSS]ac-coupled[/GLOSS]. The choice between the two depends on the objectives of a particular application. The output signal from the voltage-divider is composed of an alternating-current (ac) component (which corresponds to the flame flicker) superimposed upon a dc component (which corresponds to the flame brightness). If only the flame flicker is of interest then the use of an ac-coupled amplifier is appropriate since it removes any dc component and maximises the resolution of the flame flicker signal. Typical proven circuits for both types of amplifier are presented in Figure 3. In both cases, the circuits employ an [GLOSS]operational amplifier[/GLOSS] (such as model: LM158, National Semiconductor), and the amplifier gain is given by:
 (2)
(2)
Where Vo1 is the input voltage to the amplifier from the voltage-divider circuit and Vo2 is the output voltage from the amplifier. As a rule of thumb, the value of R2 can be specified as 1MegaOhm and R1 can be chosen according to the desired amplification gain [5].

Figure 3: Amplifier circuit layouts, (a) dc-coupled (b) ac-coupled
5. Post-processing of the flame signal
There are a number of methods to analyse the acquired flame signal to extract useful information about the flame. In the time domain, the dc component (mean) of the flame signal represents the average flame brightness that can depend on the air-fuel ratio and fuel composition. However, in many situations, the ac component of the flame signal (flicker) can provide insight into the dynamic state and quality of the flame. Signal processing techniques using higher-order [GLOSS]statistical moments[/GLOSS] (such as the [GLOSS]kurtosis[/GLOSS] and [GLOSS]skewness[/GLOSS]) have been employed to quantify the amplitude distribution of the flicker signal. For instance, the kurtosis has been found to be useful in detecting [GLOSS]non-Gaussian[/GLOSS] distributions in the flicker signals, which in turn can be related to changes in the operating states of pulverised coal fired flames [6]. The frequency content of the flicker as characterised by the power spectral densities of the signals has also been used. Recently more advanced techniques such as the Wavelet-Transform, which analyses both the time and frequency information is finding increasing application. The simultaneous resolution of these different types of data is particularly suitable for [GLOSS]non-stationary[/GLOSS] flame signals. There are also other signal processing methods that may be adopted, and the measurement and subsequent interpretation of flame radiation to yield flame characteristics is a rapidly developing field.
Sources
[1] Bryant, J.A. (1980) Update Your Flame-Monitoring Know-How. Power, vol. 124, pp. 21-25.
[2] Hurle, I.R., Price, R.B., Sugden, T.M. and Thomas, A. (1968). Sound Emission from Open Turbulent Premixed Flames. Proc. Roy. Soc. A., vol. 303, pp. 409-427.
[3] Bandaru, R. V., Miller, S., Lee, J., Santavicca, D. A. (1999) Sensors for measuring primary zone equivalence ratio in gas turbine combustors. Proceedings of SPIE – The International Society for Optical Engineering, vol. 3535, pp. 104-114.
[4] Gaydon, A.G. and Wolfhard, H.G. (1979) Flames – Their Structure, Radiation and Temperature. John Wiley & Son, New York (Forth Edition).
[5] Tan C.K, (2003). The monitoring of near burner slag formation. PhD Thesis, University of Glamorgan.
[6] Daw, C.S., Finney, C.E.A., Bailey, R.T., Flynn, T.J. and Fuller, T.A. (2002) Real-Time Monitoring of Dynamical State Changes in Staged Combustion. Proceedings of IMECE2002 ASME International Mechanical Engineering Congress & Exposition, November 17-22, New Orleans, Louisiana, USA.
