-
How do I use an FTIR – problems and good operating guidelines?
Date posted:
-
-
Post Author
dev@edge.studio
1. General
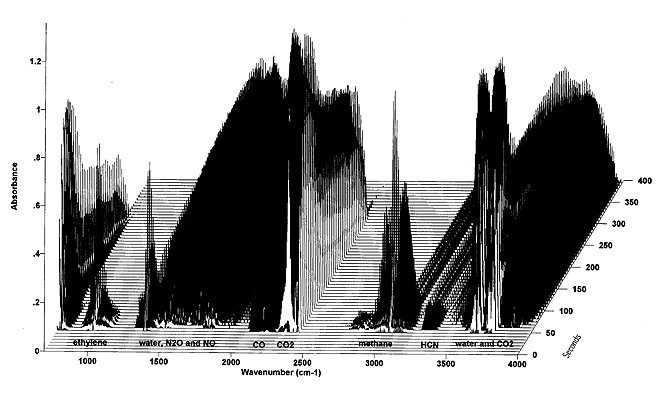
Because of its ability to detect and register many important gases, such as CO, CO2, CH4, NH3, HCN, NOx, N2O, SO2, HCl, H2O and other heteroatomic molecules, infrared spectroscopy is quite a universal method for gas analysis. On the basis of the properties of the Fourier transformation infrared, [GLOSS]FTIR technique[/GLOSS], the main advantages are:
– high scan speed, e.g. on-line measurements or kinetic experiments
– high sensitivity, e.g. for measurements in the low ppm range
To take advantage of these features the type of the detector used is very important. Common detectors for high performance FTIR spectroscopy are [GLOSS]pyroelectric[/GLOSS] detectors (e.g. DTGS, Deuteride Triglyceride Sulphide) and above all semiconductor quantum detectors (e.g. MCT, mercury-cadmium-telluride), which have a higher signal-to-noise ratio and a far shorter response time. Semiconductor detectors have to be cooled with liquid nitrogen (-196 °C).
2. Requirements and components
For concentration measurements of gases of rapidly proceeding combustion processes the FTIR analyser should meet the following specifications:
- [GLOSS]Resolution[/GLOSS]: 0.5 cm-1 or lower (e.g. 0.25 cm-1) is recommended; otherwise gases in the same spectral range, e.g. NO and H2O, can not be distinguished and thus not determined explicitly.
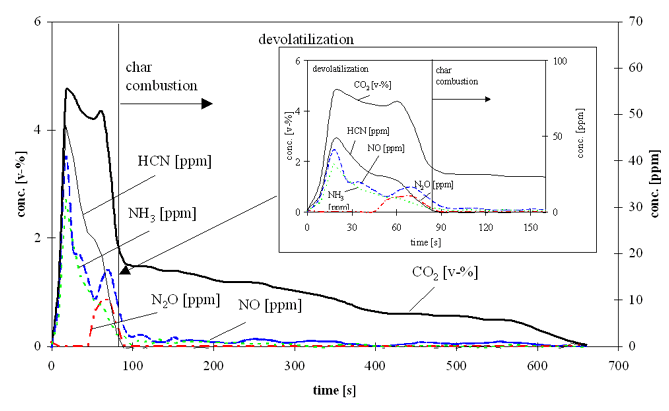
- The recording of one single spectrum should not take longer than 1 – 2 seconds, or fast reactions, e.g. the devolatilization of coal particles, cannot be obtained completely.
In addition the subsequent components are required for gas analysis:
- Gas cell: a small volume and a long optical path length are to be preferred (e.g. 220 cm3 and 7 m), because these support a good time resolution at a high sensitivity.
- Gas pump: It has to feed at a constant flow rate, to be oil and fat free and made of resistant material (e.g. membrane pumps).
- Sample line: The cross section of the tube should be small to reach high flow rates and short resident times. It also should be equipped with filters.
- If there are water or water-soluble gases to measure, e.g. HCl or NH3, the whole line between the gas sampling location and the gas cell have to be heated to at least 110 °C, to avoid condensation and absorption.
Example of benchmarks for FTIR periphery for gas analysis:
The sample line is a tube with an inner diameter of 4 mm, the pump feeds with 3.5 dm3/min and the volume of the cell is 220 cm3 at 7 m optical path length. At a temperature of 110 °C the mean flow velocity is about 6.1 m/s and the average resident time of the gas in the cell is about 3.8 s.
3. Evaluation of FTIR measurements
The output of a FTIR spectrometer is an infrared spectrum, i.e. wavenumber versus absorbance or transmittance. This can be evaluated in two different respects:
- The qualitative information is given by the wavenumbers of the peaks in the spectrum. Each species shows peaks at characteristic wavenumbers. These peaks can be compared with peaks from reference spectra to identify the species.
- The quantitative data is found as a function of the absorbance, in the height or in the area of a peak. In absorption spectroscopy, including IR, the fundamental equation which governs the relation between the intensities of the incident and the transmitted radiation (I0 and I respectively) and the concentration c is referred to as the Lambert-Beer law (1).
log I0/I = log 1/T = A = acd (1) Where:
– a is the molar decadic absorption coefficient (L.mol-1.cm-1)
– c is the concentration (mol/L)
– d is the optical path length (cm)Certain requirements are assumed to be met in the derivation of this law. Some of the major ones are:
- monochromatic light with parallel rays
- no stray light
- parallel entrance and exit planes
- no molecular interaction
It is difficult to meet all these requirements. In most cases a plot of absorbance versus concentration shows a non-linear dependence.


4. Problems
Many times the infrared spectra of gases show peaks close to each other. The quantitative measurements of such gas mixtures can be difficult. This overlapping depends on the current matrix of species. It is not possible to give a generally valid proposition at which wavenumber a gas can be measured under all conditions. Rather before quantitative results can be started, the existing species have to be determined, their interaction analysed and a coincidence-free wavenumber found. If this is not possible, other methods can be used, e.g. substraction methods, mathematical analyses.
Sources:
B. Schrader, Infrared and Raman Spectroscopy – Methods and Applications, VCH 1995
C. Wartha, An Experimental Study on Fuel-nitrogen Conversion to NO and N2O and on Carbon Conversation under Fluidized Bed Conditions, PH.D.-Thesis, University of Technology, Vienna, Institute of Chemical Engineering, Fuel and Environmental Technology, 1998
