-
How do I calculate the emissivity of combustion products from oil combustion?
Date posted:
-
-
Post Author
dev@edge.studio
Users of this combustion file should note:
- The same data shown graphically in this combustion file can also be derived using a Microsoft Excel Worksheet.
- The Excel Worksheet allows the user to calculate combustion product emissivity directly by inputting partial pressures, beam length, soot concentration and temperature.
- This worksheet can be downloaded by the reader and saved to a local hard disk.
- To achieve this click on the ‘xls’ icon on the left hand side of the banner above. The file will be retrieved from the server, and with up-to-date versions of the browser, will appear in a separate window, from which it may be saved to the user’s hard disk.
- With the exception of the data input cells, the data in these worksheets are protected – thus the reader cannot change the worksheet without knowledge of the protection password.
- However the reader can copy and paste the data into his/her own project work book as required – at this point the accuracy and integrity of the data becomes the responsibility of the reader.
- All credits and sources, and where necessary, instructions/advice for data use, are presented in this html file. These are not necessarily reproduced in the Excel Work Sheets.
1. What factors influence the emissivity of fossil-fuel combustion products?
Radiant emission from flames and hot combustion products in high temperature furnaces and boilers is usually the primary mode of heat transfer. Consequently, to calculate the heat transfer in any combustion plant, it is important to know the [GLOSS]emissivity[/GLOSS] of the gases.
The radiation from flames and combustion products is primarily due to carbon dioxide and water vapour. The total emissivity (eg) of the combustion products is a function of the number of molecules of absorbing gases (CO2 and H2O) in the path of the radiant beam. Consequently, emissivity increases as both the beam length and the pressure of CO2 and H2O increases. Emissivity is in fact correlated to the product of [GLOSS]partial pressure[/GLOSS] and [GLOSS]beam length[/GLOSS] (see CF95 for a simple formula), where the partial pressure (p bar) is the sum of the partial pressures of the absorbing gases (p =pC + pw where pc is the partial pressure of CO2 in bar, and pw that of water vapour). The temperature of the gas is also important; emissivity decreases as temperature increases.
The presence of soot or carbon particles in the gases also increases emissivity, giving rise to the luminous appearance of certain flames. Soot can increase the total emissivity of flames significantly. The effect of soot on emissivity can be calculated using the downloadable spreadsheet calculator at the top of this page.
Data on the total emissivity of CO2, H2O and soot mixtures are available in the literature [1-4]. In some cases the data have been usefully correlated using a mixed grey gas model [5,6,7], which can then be applied in ZONE models for the calculation of thermal radiation in furnaces.
2. What are the partial pressures of radiating gases in fuel oil combustion products?
Fuel oils include a wide range of liquid hydrocarbon fuels such as kerosene, gas-oil, and light, medium and heavy fuel oils. Their compositions are often complex but generally they all contain around 85% by mass of carbon and 12% by mass of hydrogen (the balance being sulphur, oxygen, nitrogen and ash). Consequently the products of combustion of fuel oils contain approximately equal volumes of water vapour and carbon dioxide. In practice the ratio of water vapour to carbon dioxide by volume is around 1¡À0.1. This differs from the combustion products of natural gases that have a ratio of two. Consequently, combustion product emissivity data sets are generally presented in the literature for two conditions:
Data for pw/pC = 2 (for natural gas combustion)
Data for pw/pc = 1 (for fossil fuel oil combustion)
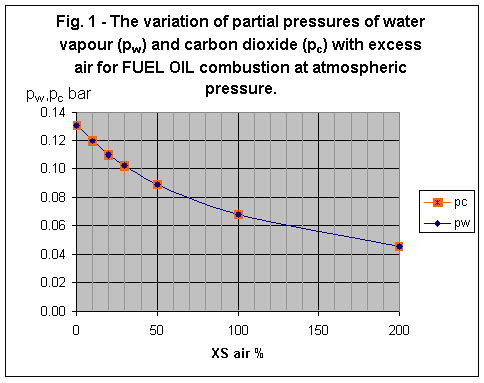
The stoichiometric products of fuel oil combustion contain approximately 13% H2O and 13% CO2 by volume; these are concentrations on a wet basis. For atmospheric pressure combustion, these concentrations are equivalent to partial pressures of 0.13 bar. As air/fuel ratio is increased, the partial pressures decrease. Fig. 1 gives a simple plot of pw and pc for normal atmospheric pressure combustion of a typical fuel oil over a range of air/fuel ratio conditions from [GLOSS]stoichiometric[/GLOSS] to 200% [GLOSS]excess air[/GLOSS].

3. What is the emissivity of fuel oil combustion products?
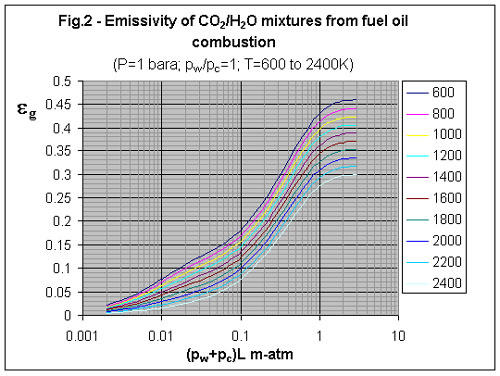
The emissivity of fuel oil combustion products is plotted in Fig.2 for a range of values of the product pL (partial pressure x beam length, where p = pC + pw) and for the normal range of temperatures occurring in furnaces (600 to 2400K). If you don’t know the partial pressures, simply read off appropriate values for pw and pc from Fig.1 for your known excess air level. Add these together and multiply by the mean radiating beam length in metres, then read off the emissivity from Fig. 2 for the corresponding gas temperature.
It should be noted that the emissivity values in Fig.2 approach a limiting value at high partial pressure-beam length products that is significantly less than one. This is because in combustion products that contain no carbon or soot, there are bands in the spectrum where the gases do not radiate (so-called ‘windows’). The combustion products are non-grey.

4. Emissivity Calculator
Emissivity values can be calculated directly using the Microsoft Excel worksheet, which can be downloaded from this combustion file (see instructions above). Emissivity is calculated using a 3 term mixed grey-gas model as described in CF44 by inputting values for pw,pc,L,T and carbon or soot concentration c in kg/m3. This model was derived by the UK Atomic Energy Authority [5]. It is valid over the following conditions:
q pw/pc = 1
q Total pressure P = 1 bara
q 0.002 < (pw+pc)L < 2.0
q T = 600-2400 K
q L=0.01-10 metres
q Soot concentration c greater than or equal to 5×10⁻³ kg/m3
The user is alerted if data is entered outside of these ranges.
The mixed grey gas parameters are shown at the bottom of the worksheet. The user may copy and paste these for use in a radiation ZONE model.
5. Effect of soot on emissivity
The effect of soot on emissivity cannot be shown using a simple graph. To derive an estimate of emissivities of a H2O, CO2 and soot mixture download the spreadsheet calculator and input the appropriate values.
Sources
[1] Robert Siegel & John R.Howell, Thermal Radiation Heat Transfer, 3rd Edition,
1992, Hemisphere, ISBN 0891162712
[2] W.A.Gray and R.Muller, Engineering Calculations in Radiative Heat Transfer, Pergamon Press, 1974
[3] Hottel and Sarofim , Radiative Transfer, McGraw-Hill, 1967.
[4] Hottel H.C., Radiative Transfer in Combustion Chambers, J.Inst.Fuel, June 1961, p220.
[5] Truelove, J.S. A mixed grey gas model for flame radiation, United Kingdom Atomic Energy Authority Report AERE-R 8494, Harwell, 1976.
[6] Taylor P.B. and Foster P.J., The total emissivities of luminous and non-luminous flames, Intl. J. Heat and Mass Transfer, 17,pp1591-1605, 1974.
[7] Smith T.F., Shen Z.F., Friedman J.N. Evaluation of coefficients for the weighted sum of gray gases model, Trans.A.S.M.E., 602, Vol.104, Nov 1982.
