-
How do I apply Laser Sheet Visualisation in industrial flames?
Date posted:
-
-
-
Post Author
Neil Fricker
-
1. Background
Laser Sheet Visualisation ([GLOSS]LSV[/GLOSS]) techniques were developed for application in laboratory bench scale systems, including flames. The basic principles of [GLOSS]Mie scattering[/GLOSS] applied to LSV and the analysis of mixing in an industrial flame were outlined in a related Combustion File (CF 119) along with an example of application of the technique to a staged natural gas flame.
This Combustion File focuses on detailed application techniques, and some of the practical precautions to be taken when applying the technique in industrial scale flames.
2. The basic Mie Scattering Equations
The basic equations used to make quantitative measurements in flames using the LSV technique are summarised below (CF119).
Under ideal conditions, the instantaneous light scatter intensity I from a particle-laden fluid is directly proportional to the number of particles in the measurement volume. Thus:
I = kρZ (1)
where:
ρ is the fluid density (kg/m3)
Z is a property of the fluid that is strictly equivalent to the mixture fraction of the seeded fluid in the measurement volume.
k is a constant of proportionality
Mixture fraction is usually normalised to its initial value in the seeded flow, defined as unity. Thus:
Z = (I/I0) x (ρ/ρ0) (2)
where:
I0 is the value of scattered light intensity from the undiluted fluid, typically determined by a measurement in the [GLOSS]potential core[/GLOSS] of the jet of seeded fluid of density ρ0
3. Experimental arrangement
A typical experimental arrangement for LSV investigation of industrial scale flames is given schematically in Figure 1, based on the set up applied successfully at the IFRF [1]. Figure 2 shows such equipment in use on one of the IFRF furnaces.
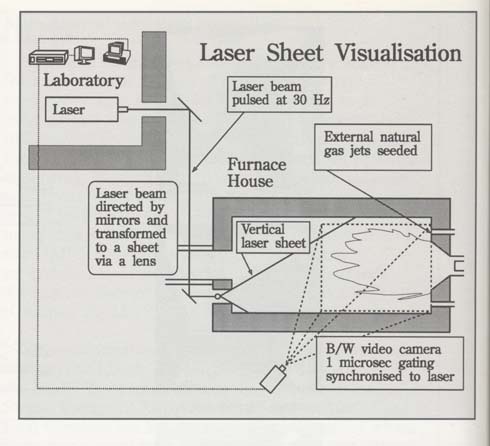
Figure 1: General experimental arrangement for Laser Sheet Visualisation in industrial scale flames
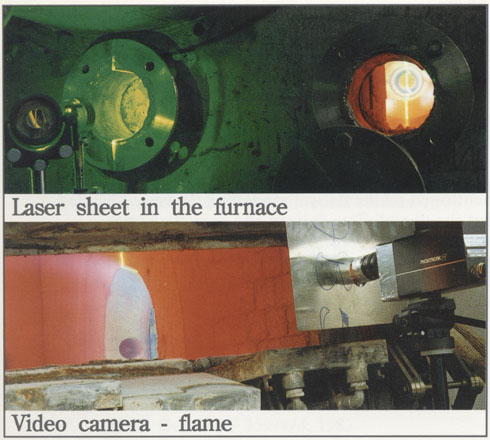
Figure 2: LSV equipment on an IFRF Furnace
At the IFRF, the laser sheet is produced by expanding the beam of a [GLOSS]ND:YAG laser[/GLOSS] (wavelength 532 nm) through a cylindrical lens to yield a laser sheet with a nearly constant thickness of 1.2 mm over an area of 1m2[1].
The region of interest is recorded with a black and white [GLOSS]CCD[/GLOSS] camera with a minimum gating time of 1 microsecond synchronised to the 190mJ pulses (25 to 30 pulses per second) of the laser.
At the IFRF, the laser sheet is introduced into the furnace through a small slit. The slit was located 6m from the burner at the rear of the furnace. The laser sheet was vertically orientated, and the CCD camera placed to view the flame from the side of the furnace (Figure 2).
The short gating time suppresses the flame radiation of even the most luminous flames and only allows the recording of scattered light.
A 40 nm bandwidth filter can be used to suppress any infrared radiation incident on the image intensifier or the CCD sensor.
The spatial resolution per pixel is determined by the laser sheet thickness and the camera magnification; it is typically of the order of 1mm3.
Once the system is set-up, a few minutes are sufficient to record the laser sheet. Thus, a large number of burner configurations can be characterised in a relatively short time.
4. Experimental precautions to approach ‘ideal’ Mie scattering
In order to approach the ideal conditions under which equations (1) and (2) are valid, the following experimental conditions must be achieved.
Particle Size
The particles must be small enough to follow the mixing and diffusion of the molecules of the seeded fluid, and to scatter sufficient light at the wavelength used to illuminate the flow. Particle sizes of circa 1 micrometre have been found to satisfy these criteria [2][3].
The particles must be mono-sized over the measurement volume. Flows seeded with particles classified to a size range of 0.3 micrometres to 2.0 micrometres have been found satisfactory [2].
Particle Loading
The particle concentration must be low enough to avoid:
¢®¢´ any affect on the properties and flow of the fluid under study
¢®¢´ multiple scattering and optical attenuation
The particle loading in the seeded fluid must be maintained constant for the duration of the experiment.
Particle Properties
The scattering behaviour of the particles must be unaffected by temperature changes when studying mixing in flames. Zirconium Oxide particles have been found satisfactory.
Illumination
The intensity of the laser illumination must not vary in time or within the measuring space.
When using divergent light beams, or if the concentration of the particles is high enough to give rise to attenuation, these effects should be quantified and corrected for during the calibration of the optical instrumentation. The difficulty with correcting the variation in illumination intensity over a large surface is one of the main causes of inaccuracy in the quantitative analysis of LSV images.
Fluid properties
The molecular diffusivity coefficients of the mixing fluids should be equal. Their molecular and thermal diffusivities should be equal ([GLOSS]Lewis number[/GLOSS] = 1). These conditions are normally satisfied when studying conventional fuels and [GLOSS]comburent[/GLOSS]s. [1]
5. Typical LSV images from a natural gas flame
Figure 3 shows the regular image for a natural gas flame, fired through the staged burner illustrated in Figures 1 and 2, in this instance in a cold furnace.
Figures 4a and 4b show the output that can be obtained from this natural gas flame applying LSV. The former clearly illustrates the staged air jets above and below the central burner exit and their subsequent mixing into the downstream flame zone. The flame itself, which is visible in Figure 3 is no longer visible in Figure 4a.
Figure 4b shows the computer “grabbed” version of 4a with assigned colours. Figure 5 illustrates the potential for using computer power on a multiplicity of images.
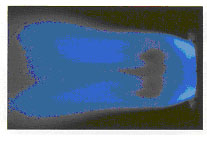
Figure 3 – Normal image of a staged natural gas flame
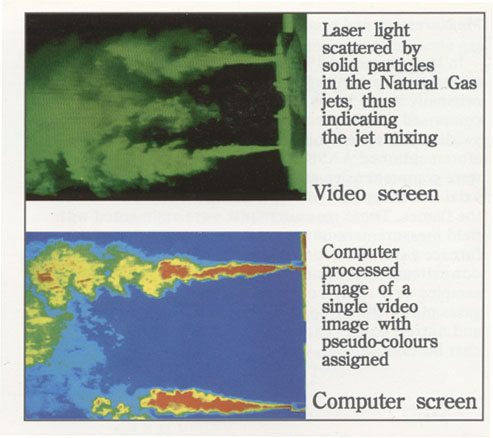
Figures 4a (top) and 4b (bottom): LSV images of a staged natural gas flame (natural gas jets seeded)
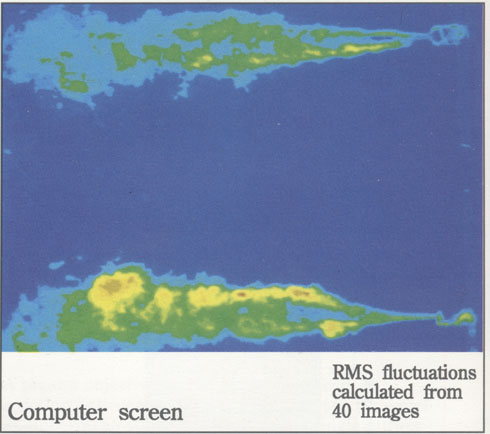
Figure 5: Illustration of use of LSV for statistical analysis of flow in a staged natural gas flame (natural gas jets seeded)
Figures 6 and 7 are the raw, but averaged video captures.
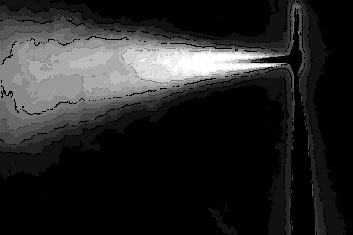
Fig. 6: The average mixing field from 256 images
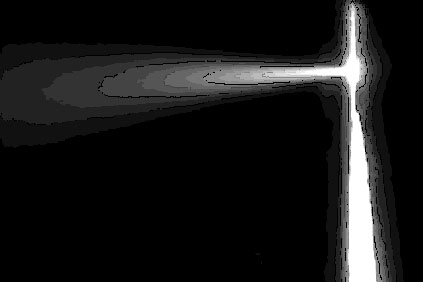
Fig.7: Standard deviation from 256 images
Note that this type of image highlights the boundaries of the jet fluctuations
6. Use in oil and coal flames
Experiments with oil and coal flames have shown that the technique is limited by the flame particle loading.
Oil flames
In oil flames, this limitation applies in a small region near the fuel atomiser where the droplet density is high enough to absorb a significant amount of laser light.
The technique may also be applied directly to studying liquid sprays (CF222).
Coal flames
In coal flames, coal and ash particle loadings will often be too high for Laser Sheet Visualisation,. The technique, however, may still be used in such flames to provide qualitative information on fuel jet/secondary air mixing and on the interaction between a jet and a recirculation zone.
Soot formation
The LSV technique can provide a means to visualise soot formation and combustion in oil and gas flames (CF222).
7. Further support
IFRF members wishing for further support in the design or application of LSV systems at industrial scale may request copies of the detailed IFRF reports dealing with this topic.
Sources
[1] P A Roberts (Editor), Research at IJmuiden during the Triennial 1989-1991, IFRF Doc No: K65/y/3
[2] J Dugue, A Mbiock and R Weber. Mixing Characterisation in Semi-Industrial Natural Gas Flames using planar Mie-Scattering Visualisation. 7th |International Symposium on Application of Laser Techniques to Fluid Mechanics, Jul 1994, Lisbon, Portugal (Also available as IFRF Doc No K 70/y/78)
[3] H A Becker, H C Hottel, & G C Williams. On the Light Scatter Technique for the Study of Turbulence and Mixing. Journal of Fluid Mechanics, 30, part 2, pp 259-284 (1967)