-
How can gas species be measured in high pressure combustion systems using tuneable diode lasers?
Date posted:
-
-
Post Author
dev@edge.studio
A gas molecule can occupy several discrete energy states. Transitions between these energy states are associated with special absorption features of a gas.
In [GLOSS]tuneable diode laser[/GLOSS]spectroscopy, the emission wavelength of a tunable laser is scanned over such an individual, entire absorption feature.
Tunable diode laser spectroscopy offers several advantages, listed below.
Compared to fixed-wavelength methods, this technique allows distinction between resonant absorption and non-specific beam attenuation due to e. g. scattering or beam steering.
Compared to FT-IR based methods, the laser line width is extremely narrow so that single [GLOSS]rovibrational[/GLOSS] lines can be resolved and measured individually. Interference effects by present species other than the one to be detected can be excluded.
A fast time response, a high selectivity and specificity, compact and robust sensors for field use are the key benefits of the technique described here.
A related combustion file (CF185) deals with the general use of tuneable diode lasers for gas concentration measurements. This file gives further detail of the basis of the technique and the analysis needed to apply it.
2. Experimental trouble with pressure
It is essential to tune the laser frequency over an entire absorption peak in order to discriminate resonant absorption form non-specific attenuation of the laser beam. However, pressure leads to a significant broadening of spectral lines.
Due to quantum mechanical reasons, absorption peaks are not infinitely sharp.
The natural line width results from Heisenberg’s [GLOSS]uncertainty principle[/GLOSS]. The natural line width, however, can normally be neglected.
By interactions with neighboring atoms and molecules, the energy levels of the molecule under investigation are disturbed. The spectral broadening that is caused by these distortions is called collision broadening. The mechanism of collision broadening is relevant at pressures of approximately 1 bar and above.
A [GLOSS]Lorentzian function[/GLOSS] is used to describe the shape of the absorption feature.
At lower pressures, typically below 100 mbar, the [GLOSS]Doppler effect[/GLOSS] dominates spectral broadening and hence the line shape.
Doppler broadening can be described by a [GLOSS]Gaussian function[/GLOSS].
In intermediate pressure regimes where both effects on the line shape function have to be considered, a [GLOSS]Voigt function[/GLOSS] is usually used. It is a convolution of Lorentzian and Gaussian line shape functions and transforms into its two extremes at high and low pressures respectively.
Therefore, the Voigt function is the general line shape function that is usually used.
In the following Figure 1, the three line shape functions Lorentzian, Gaussian and Voigt profiles are depicted.
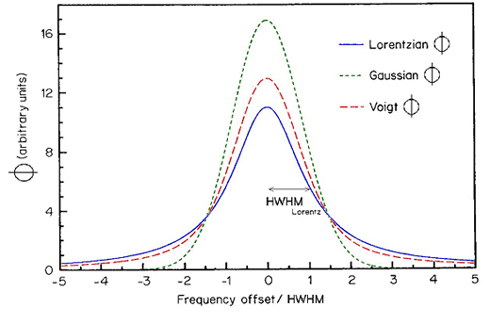
Fig.1: Normalized line shape functions. Note that the Voigt profile lies in between the Lorentzian (high pressure) and Gaussian (low pressure) extremes. The Voigt profile corresponds to the pressure where gL = gD.
Depicted is the HWHM (half width at half maximum) for the Lorentzian line shape function.
The line shape function Ф is normalized to unity:
For the use of the line shape function to obtain the absorbance, see CF122.
The Lorentzian line width gL[cm-1] (HWHM) can be obtained from database entries for self broadening gself [cm-1 atm-1] and air broadening gair[cm-1 atm-1].
Spectroscopic databases such as [GLOSS]HITRAN[/GLOSS] contain all parameters that are necessary for the calculation of absorption spectra.
gself [cm-1 atm-1] describes spectral broadening by collisions with molecules of the same gas, whereas gair [cm-1 atm-1] accounts for broadening by collisions with molecules of different gases.
The following table 1 shows an excerpt from the data base HITRAN with values of gself [cm-1 atm-1] and gair [cm-1 atm-1] for CO2 near 2.00 µm.
|
Frequency [cm-1] |
Frequency [µm] |
gair [cm-1atm-1] |
gself [cm-1atm-1] |
Tc [1] |
| 4984.526883 | 2.006208 | 0.08 | 0.1103 | 0.64 |
| 4985.932641 | 2.005643 | 0.078 | 0.1079 | 0.64 |
| 4987.308758 | 2.005089 | 0.0762 | 0.1055 | 0.64 |
| 4988.655203 | 2.004548 | 0.0747 | 0.1032 | 0.64 |
| 4989.971943 | 2.004019 | 0.0734 | 0.1009 | 0.64 |
| 4991.258945 | 2.003503 | 0.0722 | 0.0987 | 0.64 |
Table 1: Excerpt from the database HITRAN. For the chosen lines of CO2 the pressure broadening amounts, on average, to 0.076 cm-1 per atmosphere for broadening by different gas molecules (gair) and to 0.104 cm-1 per atmosphere for broadening by CO2 itself gself. The values of g are given for 296K. To account for the temperature dependence of gair and gself, one needs an additional parameter, Tc. g(T) = g(296K)*(296/T)^Tc.
The Lorentzian line width gL[cm-1] (HWHM) is given by
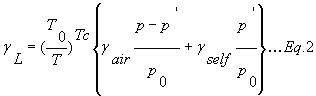
T [K] is the gas temperature.
T0 is the reference temperature (296K).
p0 is the reference pressure (101325 Pa).
p’ is the partial pressure of the gas [Pa].
p is the total pressure [Pa].
Tc is the coefficient for the temperature dependence of gL[cm-1].
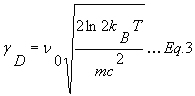
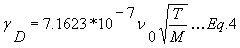
The Doppler width gD [cm-1] (HWHM) only depends of the mass of the molecule and the temperature.
gD is given by
or
respectively.
m is the mass [kg].
M is the molar mass [g/moles].
T is the temperature [K].
kB is the Boltzmann constant (1.38*10-23 J/K).
c is the speed of light [ms-1].
n0 is the center frequency of the transition [cm-1].
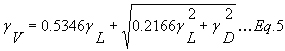
The Voigt line width gV [cm-1] (HWHM) can be approximated by the following equation:
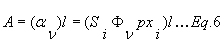
To calculate absorbance spectra, one needs to know the value of anl with an being the absorption coefficient, n the frequency [cm-1] and l the path length [cm]. The absorption coefficient an is a product of the line strength S times the line shape function f times the partial pressure of the absorber pxi (see CF122).
The line strength S is a function of the temperature.
an has to be calculated for each absorption line.
The total absorbance A (for a given temperature T, pressure p, path length l and mole fraction x) is obtained by integration over the contributions of all lines according to Aν = Si*Фν*p*xi*l. The line shape function Фν is chosen according to the pressure. As stated above, a Gaussian function is usually used at low pressures (up to 100 mbar), a Lorentzian function at high pressures (starting at 1 atm) and a Voigt function in intermediate pressure regimes. See CF122 for details on the different parameters affecting A.
In the following Figure 2, a portion of an absorption band of CO2 is shown. The absorbance has been plotted as a function of the wave length (experimental parameters were 296K, 1m path length, mole fraction of CO2 0.1 in air, total pressure 1 atm and 5atm, respectively).
One can see well-resolved individual rovibrational lines at atmospheric pressure. At 5 atm, severe pressure broadening can be observed.
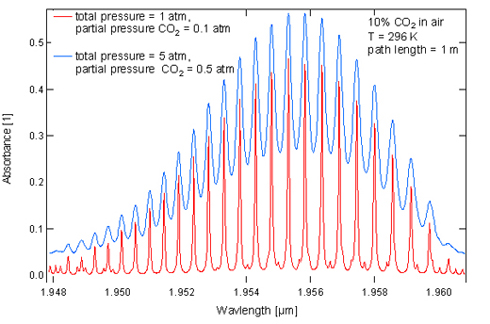
Fig. 2: Absorption spectrum of CO2 at 1 atm and 5 atm respectively. Note the extensive pressure broadening.
3. How pressure broadening can be dealt with
Conventional diode lasers cannot be frequency tuned over more than 1 – 2 cm-1. Therefore, it is not possible to tune over full rovibrational lines at pressures higher that 10 bar.
As shown in Table 1, the broadening coefficient of an absorption line is on the order of 0.1 cm-1atm-1. An absorption line that is 0.1 cm-1 wide at ambient conditions, will broaden to 1.0 cm-1 at 10 atm.
At elevated temperatures, the absorption lines become narrower, yet this effect is too small to allow the use of conventional diode lasers for scanning across the lines.
There is a special type of semiconductor lasers that have been developed recently, so-called [GLOSS]VCSEL[/GLOSS]s.
The tuning range of VCSELs is much wider than it is for conventional diode lasers. Tuning ranges of up to 30 cm-1 have been realized.
By deploying VCSEL for in-situ sensing, it is possible to measure species concentrations and temperature distributions at pressures up to 100 bar and above.
VCSEL offer several additional advantages for spectroscopists, too.
They can be modulated much faster than it is possible with conventional diode lasers. Tuning rates of several MHz have been reported.
Recently VCSEL have become available in the 1 – 2 µm wavelength range where many potentially interesting molecules show absorption lines.
Apart from this, VCSEL are inherently [GLOSS]single mode laser diode[/GLOSS] emitters and can be produced at lower costs than ordinary diode lasers.
The use of tunable diode lasers to measure species concentrations is an established technique. There are commercially available systems, some of which are used in industry, e. g. for process control.
VCSELs have not yet found a widespread commercial use in spectroscopic applications.
Sources
[1] W. Demtröder, Laser Spectroscopy, 2nd Ed . Springer-Verlag, Berlin, 1996
[2] M.-C. Amann, J. Buus, Tunable Laser Diodes, Artech House, 1998
[3] G. Totschnig, PhD Thesis, Vienna University of Technology, Vienna, 2002
[4] Rothman, L. S., Rinsland, C. P., Goldman, A. et al. The HITRAN molecular spectroscopic database and Hawks (HITRAN atmospheric workstation): 1996 edition, J. Quant. Spectrosc. Radiat. Transfer, 1998; 60 (5):665-710